Crime Rates
2012 Crime Summary
The 2012 Eugene Police Department crime reports are now online at www.eugenepolice.com.
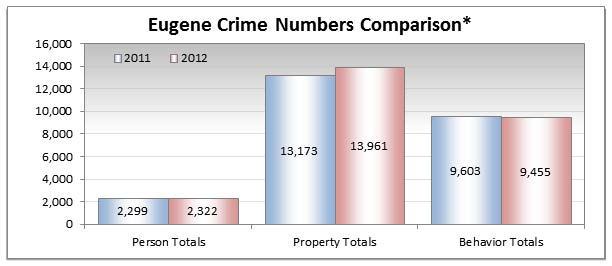
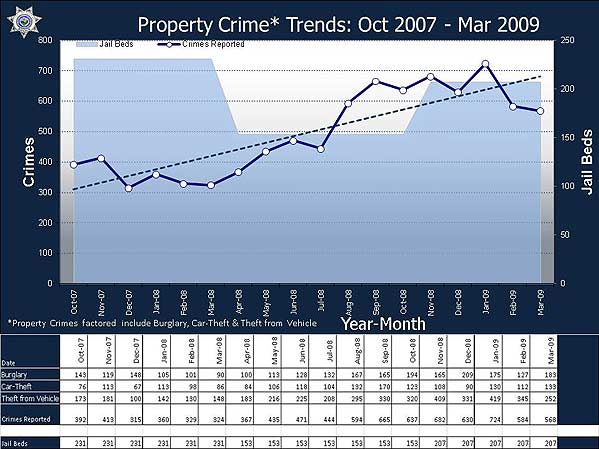
EPD Crime Analysis Unit's snapshot shows the city's total crimes increased by 2.6 percent in 2012. Since 2010, jail bed capacity has decreased by 53.45 percent, while crime totals have increased by more than 15 percent. Crimes are broken into three categories; person, property and behavior. This year, property crimes represent 54 percent of the city's total, which has been increasing over the last three years.
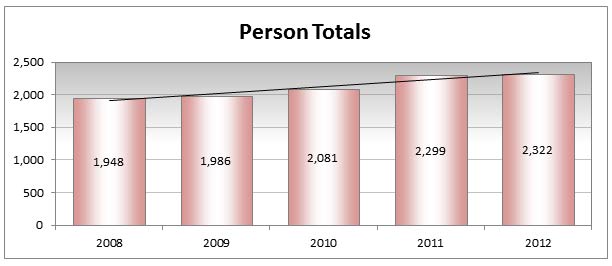
2012 Person Crimes Summary
Person Crimes overall were up 1 percent. The Person Crime Totals have been steadily increasing over the last five years. The most concerning increases in 2012 were in Robberies and Sex Offenses.
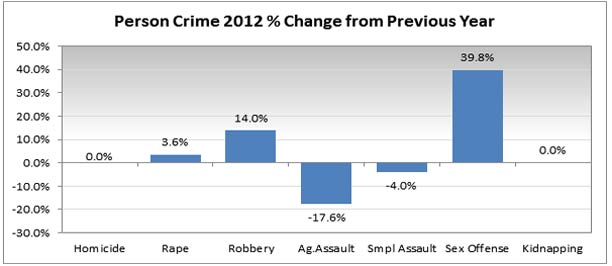
Robbery Breakdown (+14%)
Robbery is broken down into seven total categories by premise type. Robberies for the premise types including service station, convenience store, residence, bank and other were all down. There was an increase in highway/street robberies (up 29.7 percent) and business robberies (up 43.1 percent). Not only are robberies up from last year, they show an 11.5 percent increase from the three-year average.
Sex Offense Breakdown (+40%)
Sex offenses are broken down by non-forcible rape, contribute to sex delinquency, physical molest, incest, exposer, forcible sodomy, non-forcible sodomy and other. Of these categories the most concerning were non-forcible rape (up 186.4 percent) and contributing to sexual delinquency of a minor (up 825 percent). Causative factors to this high increase are two major, unrelated sex abuse cases: One individual had a total of 91 sex abuse charges and a second had a total of 17 charges. Sex offenses increased 31.7 percent from the three-year average.
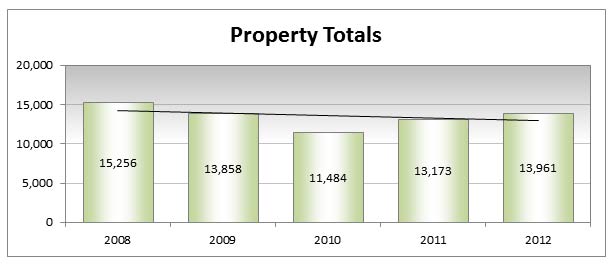
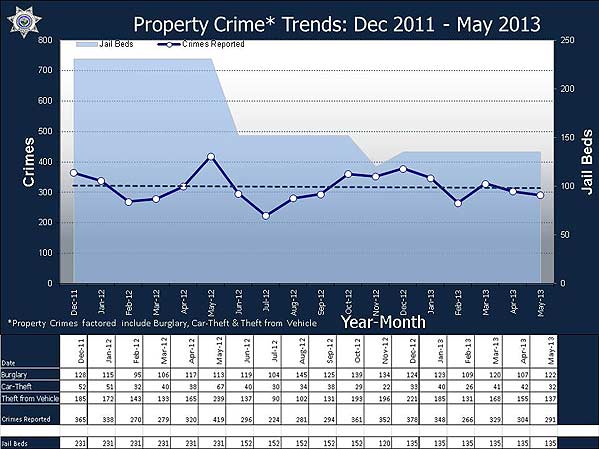
2012 Property Crimes Summary
Property Crimes for 2012 are up 6 percent. There is a three year, upward trend in Property Crimes. The most concerning in 2012 are arson and forgery. In 2012, vehicle thefts went down 22.9 percent, which is following a state and nationwide trend.
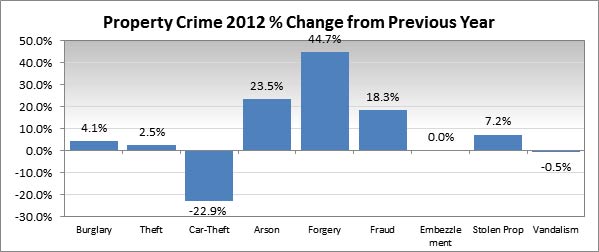
Arson Breakdown (+23.5%)
Arsons are broken down by property type: residence, other building, vehicle and all other. Arsons for 2012 were up in every category and a total increase of 23.5 percent. This year the city had at least one series of a male walking down an alley and lighting dumpsters and garbage cans as he went. Arsons and fire incidents in general are notoriously difficult to clear by arrest. Due to fire damage there is very little physical evidence.
Although Arson rates increased from last year, it is down 1.6 percent from the three year average.
Forgery Breakdown (+44.7%)
Forgery is up 44.7 percent from last year. However, in 2011 Forgery was down almost equally at -42.4 percent from 2010. In 2011, identity theft calls were not logged if there was not an actual financial loss. A change in practice occurred in November 2011 so that now these calls are being logged regardless of whether the victim suffered a financial loss or not. This change in practice is one of the reasons there is a large increase from last year. In comparison with the three-year average, the increase is only 3.4 percent.
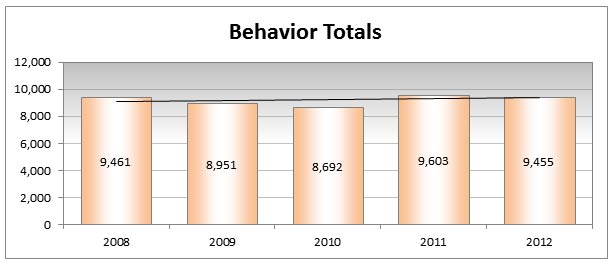
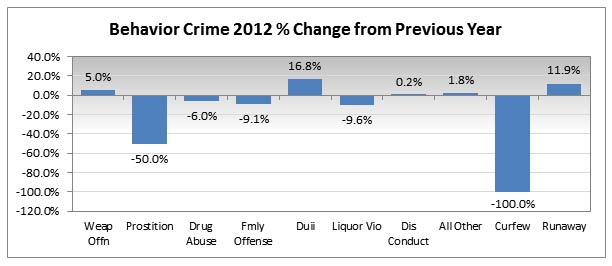
2012 Behavior Crimes Breakdown
Behavior Crimes were down 1.5 percent. The majority of behavior crime rates can be impacted by whether or not officers are in the area to observe the crime and by targeted enforcement efforts or other work that proactively addresses the crimes. When this occurs, the rate will rise. Behavior crimes are up by 2.2 percent from the three-year average. Curfew was down 100 percent this year compared to last year. In July 2011, it was reported that juvenile justice would not accept a curfew violation. Prostitution was down 50 percent but, once again, these rates are driven by proactive enforcement.